Trader Claude
Paper trading account · last checked 2026-07-04 16:15
Right now, about 20% of the money is invested in things (stocks, ETFs, crypto) and 80% is sitting in cash.
🩺 Is it still running?
If you're checking back after a while, this is the first thing to look at — it shows when each automated job last actually ran.
| Job | Last ran | Status |
|---|---|---|
| Daily (stocks/ETFs/lab) | 2026-07-04 18:00 (-1.7h ago) | ✅ healthy |
| Hourly crypto | 2026-07-04 21:12 (-5.0h ago) | ✅ healthy |
| Hourly equity | 2026-07-04 21:25 (-5.2h ago) | ✅ healthy |
📈 Your money over time
This chart shows up after the 2nd day of running. Check back tomorrow.
💼 What you currently own
This is what the account is currently holding.
| What you own | Worth (as of last close) | Share of your account | Price right now |
|---|---|---|---|
| BTC-USD | $998.23 | 10.0% | $62,741.95 |
| ETH-USD | $996.69 | 10.0% | $1,782.91 |
| Cash (not invested) | $7,998.00 | 80.0% | — |
"Price right now" is a live check — but the account itself only actually buys/sells once a day, after the market closes.
🕰️ How would this have done in the past? (backtest)
This tests "if we had used this exact strategy for the last 20 years, how would it have gone?" It's not a promise about the future — just the fairest check we have using real history, including the 2008 and 2020 crashes.
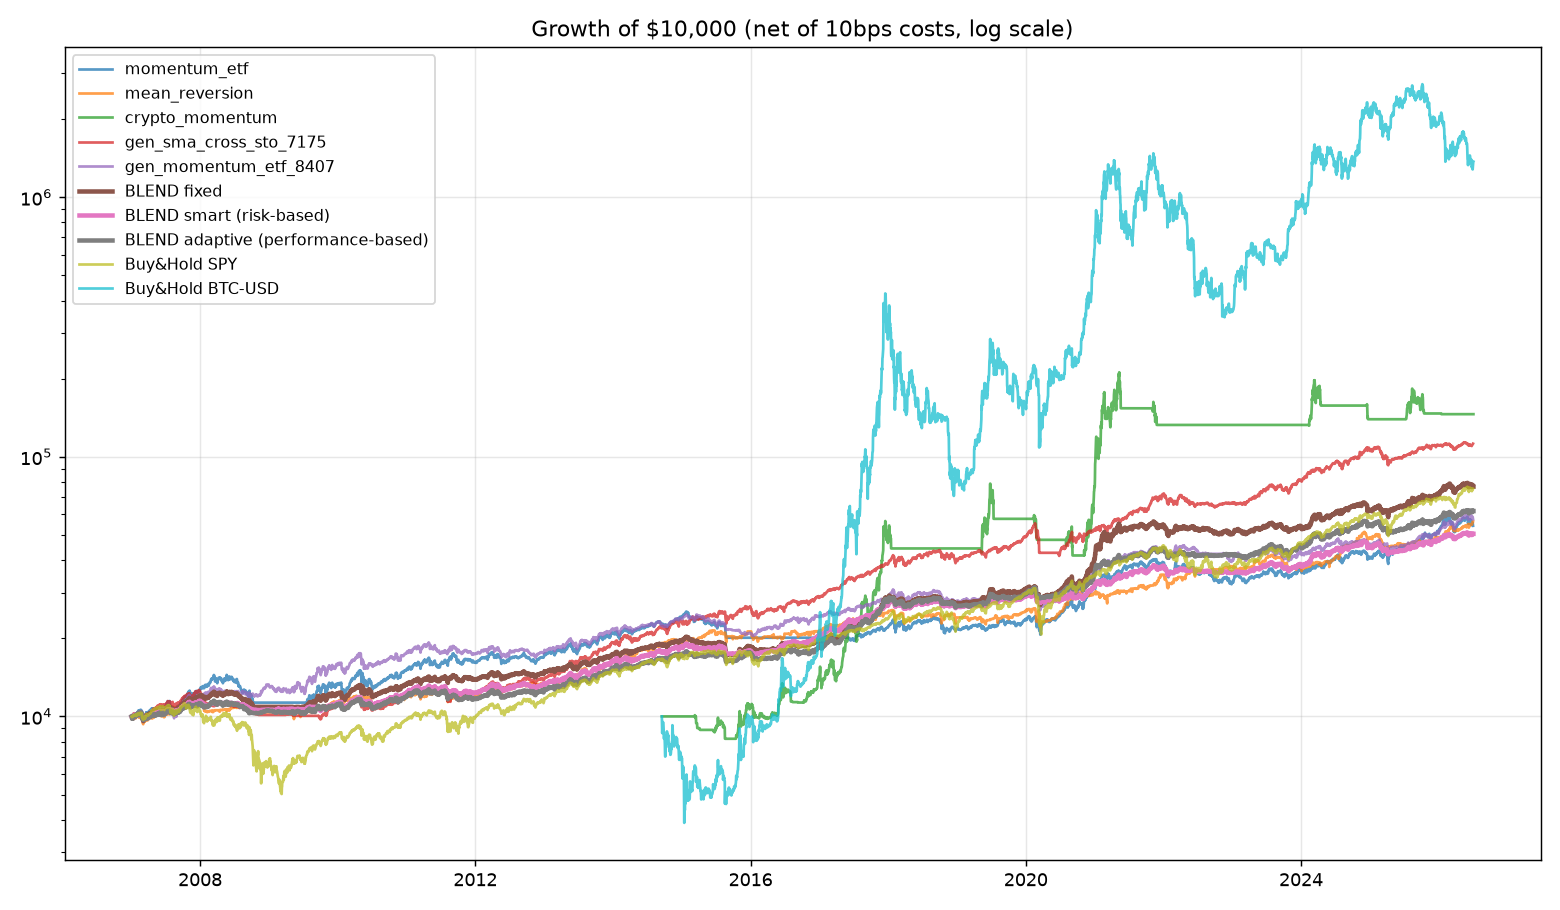
CAGR Sharpe Volatility Max Drawdown Worst Year  Final $10k
Strategy
momentum_etf                         +9.1%   0.48     +13.9%       -22.9%     -16.2%     $54,235
mean_reversion                       +9.3%   0.53     +12.5%       -18.8%     -13.7%     $56,371
crypto_momentum                     +25.5%   0.62     +25.7%       -47.1%      -9.0%    $145,957
gen_sma_cross_sto_7175              +13.2%   0.85     +12.0%       -25.1%     -18.9%    $112,334
gen_momentum_etf_8407                +9.4%   0.53     +12.8%       -17.4%     -11.8%     $57,480
BLEND fixed                         +11.0%   0.59      +9.6%       -15.7%      -8.6%     $76,746
BLEND smart (risk-based)             +8.7%   0.53      +7.1%       -10.8%      -7.0%     $50,505
BLEND adaptive (performance-based)   +9.8%   0.59      +7.9%       -11.2%      -5.9%     $61,802
Buy&Hold SPY                        +10.9%   0.47     +19.6%       -55.2%     -36.8%     $75,330
Buy&Hold BTC-USD                    +51.8%   0.75     +55.3%       -83.4%     -73.6%  $1,371,117
🎲 What could happen? (thousands of simulated futures)
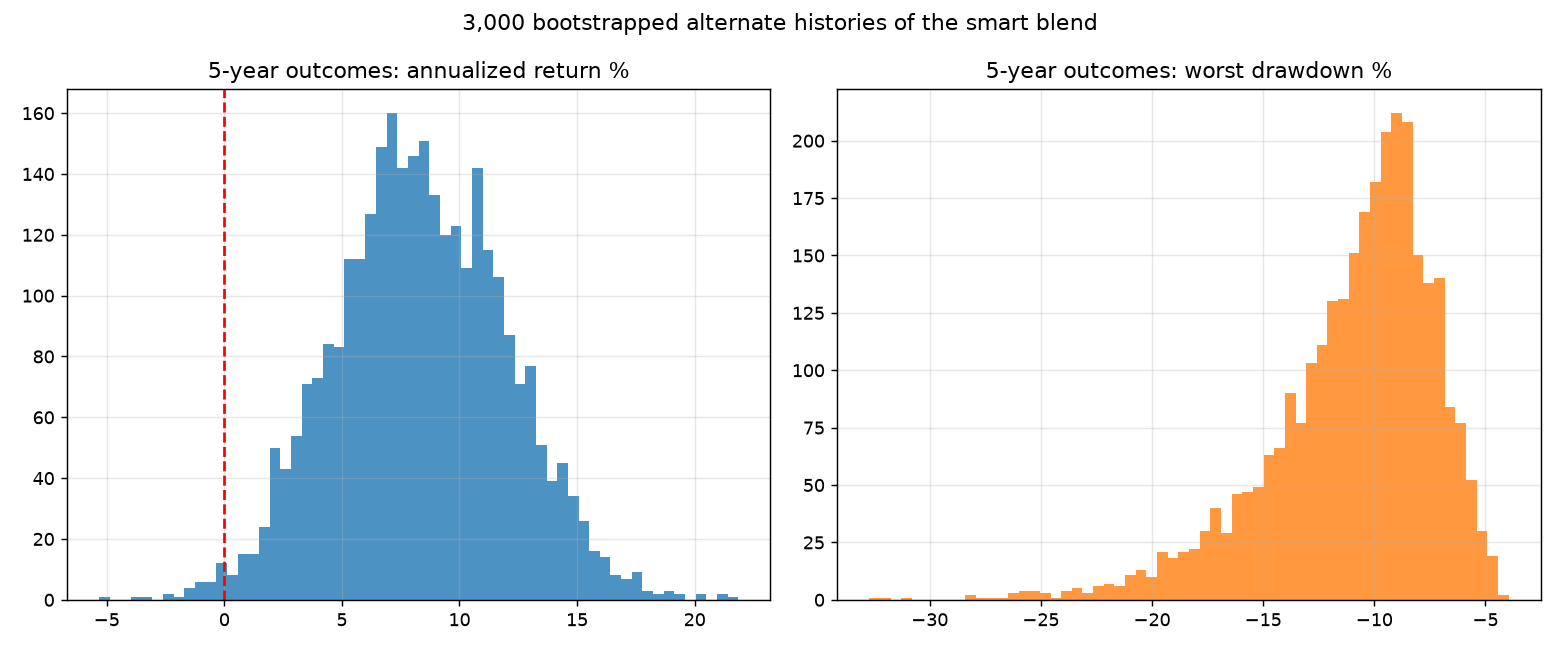
Instead of one guess, this runs the strategy through 3,000 randomly-shuffled versions of the past to show a realistic range of outcomes — good, bad, and in between.
🤖 The idea robot ("strategy lab")
Once a week, this system invents brand-new trading ideas by itself, tests each one on old data it's never seen, and only hires the ones that pass a very strict test. Every day it also double-checks its current hires and fires any that stop working.
| Idea's name | What kind of idea | How good it looked in testing | How good it's been recently | How sure we are it's not just luck | Hired on |
|---|---|---|---|---|---|
| gen_sma_cross_sto_7175 | sma_cross on stocks | 0.86 | -0.04 | nan% | 2026-07-04 |
| gen_momentum_etf_8407 | momentum on etfs | 0.51 | 1.27 | nan% | 2026-07-04 |
📊 Did our predictions come true?
When an idea gets hired, we write down how good we expected it to be. Now that time has actually passed, we can check whether it really performed that way, using real market days that hadn't happened yet when we made the prediction. This is the fairest test there is — you can't cheat at predicting the future.
| Idea's name | What we expected | What actually happened | Days we've watched it | Verdict |
|---|---|---|---|---|
| Nothing to check yet — needs at least 5 days after being hired. | ||||
🚫 Ideas we fired
| gen_sma_cross_sto_0851 | trailing 6-mo Sharpe fell to -0.65 | 2026-07-04 | |||
| gen_sma_cross_sto_1861 | trailing 6-mo Sharpe fell to -1.59 | 2026-07-04 | |||
| gen_sma_cross_sto_0694 | trailing 6-mo Sharpe fell to -0.90 | 2026-07-04 | |||
| gen_momentum_sto_8539 | trailing 6-mo Sharpe fell to -0.73 | 2026-07-04 | |||
🗒️ Recent activity (the raw log)
The detailed play-by-play, for anyone who wants to see exactly what happened each day.
  SELL $106.23 of GOOGL @ $359.91
  SELL $106.23 of AVGO @ $360.45
  SELL $82.93 of V @ $362.13
  SELL $64.77 of XOM @ $137.09
  SELL $64.77 of ABBV @ $261.07
  SELL $64.77 of COST @ $951.67
  SELL $14.18 of TSLA @ $393.45
  BUY  $32.54 of QQQ @ $712.60
  BUY  $32.54 of IWM @ $297.58
  BUY  $32.54 of EEM @ $65.70

Account value after rebalance: $9,985.72
Dashboard written to /Users/krishivjain/trader-claude/reports/index.html

===== 2026-07-04 20:58:45 (ACCOUNT RESET) =====
Hard reset requested by user: cleared all positions and history, restored cash to exactly $10,000.00

===== 2026-07-04 21:12:56 (hourly crypto) =====
Fetching hourly crypto data (Yahoo Finance limits this to ~2 years)...
  17479 hourly bars, 2024-07-05 00:00:00 to 2026-07-04 15:00:00

Quick check on available hourly history (shorter and less certain than the daily strategies' 20-year validation):
  Strategy total return: +1.6%
  Buy & hold return:     -17.0%
  Max drawdown:          -42.9%
  (17479 hourly bars available)

Target crypto weights (this hour):
  BTC-USD   10.0%
  ETH-USD   10.0%

Executed:
  BUY  $1,000.00 of BTC-USD @ $62,852.89
  BUY  $1,000.00 of ETH-USD @ $1,788.89
Dashboard written to /Users/krishivjain/trader-claude/reports/index.html

===== 2026-07-04 21:25:45 (hourly equity) =====
Market is closed right now (outside 9:30am-4pm ET, weekdays) — nothing to do.
This is expected most of the time this script runs; it only acts during market hours.
Dashboard written to /Users/krishivjain/trader-claude/reports/index.html
📖 Plain-English glossary
- Paper trading
- Simulated trading with no money actually changing hands — used to test a strategy before risking real capital.
- Backtest
- Running a trading idea against the past, like a "what if we had done this 20 years ago" test.
- Strategy
- A specific rule for deciding what to buy and sell, like "buy things that have been going up lately."
- Sharpe ratio
- A score for "how much money did you make, compared to how scary/bumpy the ride was to get there." Higher is better. A ride that makes the same money with less scary ups-and-downs wins.
- Drawdown
- The worst dip: how much money you'd lose from the highest point before it recovered. A "-20% drawdown" means at some point you were down 20% from your peak.
- CAGR
- The average amount your money grows each year, smoothed out (like saying "on average, 10% a year" even though some years are better or worse).
- Confidence it's not just luck (Deflated Sharpe)
- This system tries lots of trading ideas and only shows you the best ones. But if you try enough random ideas, one will look good by pure chance — like flipping a coin 100 times and one person getting heads 10 times in a row. This number is a fancy math check for "is this idea actually good, or did it just get lucky?"
- Diversification
- Not putting all your eggs in one basket — spreading money across different kinds of ideas so if one fails, the others can still be fine.
- Kelly sizing
- A math formula for "how much should I bet," based on how good the odds actually look right now. It's used here to bet a little less when an idea's recent results look weak.
- VIX / "market fear gauge"
- A number that goes up when investors are scared and down when they're calm — used here so the system automatically plays it safer during real-world scary times (like 2008 or 2020).
- Rebalance
- Adjusting what you own to match the plan — selling a bit of what grew too big a share, buying more of what shrank.
- Ticker / symbol
- A short code for something you can buy, like "AAPL" for Apple stock or "BTC-USD" for Bitcoin.
Paper trading account — no real funds are involved. Past performance, backtested or live, does not guarantee future results. This page refreshes itself every 5 minutes.